Keep an eye on your system
Put simply, a programmable logic controller (PLC) is simply a box with some inputs and outputs which various components are connected to. For the user, the PLC is therefore a device that gives him little information about the system to be controlled. He can only check if the controller is doing its job. However, this does not allow him to comprehend individual processes or even intervene in the system. This is where a visualisation or SCADA application comes into play. Together with the customer, we develop the right operating and visualisation system for your system – so that you can interact with it.
Process visualisation and control
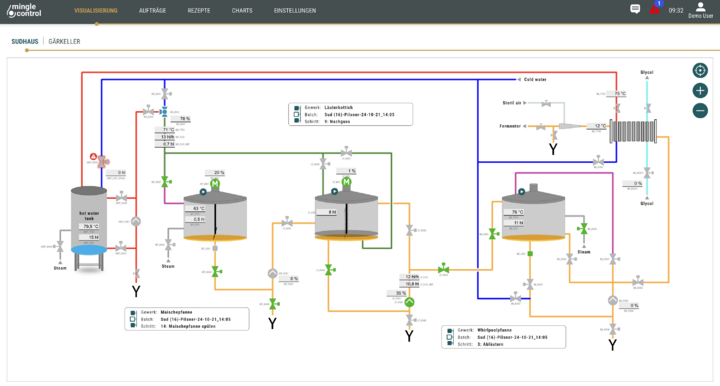
Without visualisation, all you can see is that a motor is turning over, without knowing at what speed. To change that, the primary key task is to capture data quickly and cleanly. The next step involves interpreting the parameters and all the key processes in real time on a control panel. Only then will you know the speed the engine is currently running at. Visualisation therefore provides you with an overview of the current state of the machine by allowing you to see e.g. which step is being performed, what happens next and what throughput the machine has. Another option is to display pressures, temperatures and speeds.
In order to optimise these views, various possibilities are conceivable, such as displaying an editable field or individual predefined preferences, such as "slow", "normal" or "fast". Visualisation not only makes it possible to observe the system and to display values, but also to adapt them and therefore control the system.
We develop all the necessary operating and monitoring functions in close cooperation with you. Our development team then takes over the job of programming the visualisation and pays close attention to a clear structure and intuitive operation while doing so. All the visualisation systems we design also include a double query for important entries, so that the system cannot be operated incorrectly "by mistake".


System optimisation and cost savings
A visualisation system offers you even more advantages: You can see how efficiently your system is functioning and which processes often cause problems. In turn, you can derive optimisation potential from this, thus improving the efficiency of the system and at the same time reducing costs.
The basis for this is formed by recording measurements and disruptive events. For documentation purposes, we log all important alarms, messages, events and process data in the operating system and archive them. These logs are not just recorded by date and time, but also by system status and position. A fault history with a filter function and the fault suppression of subsequent faults in the event of a problem simplify the analysis of faults considerably. Optical and acoustic signals alert the operating personnel to specific (disruptive) events immediately. Our systems also incorporate a user management system with different permissions. This allows you to assess which user was doing what on your system at any time. This increases traceability and is also recommended for insurance reasons.
We also place great value on the standardisation of interfaces and can coordinate these across several manufacturers. Although this optional service takes time, it does provide you with a total solution incorporating optimised data exchange between different systems, which minimises susceptibility to disruptions and increases the availability of your system. Our highest expansion level offers you a complete control system consisting of several PCs and operator stations which exchange specific data with external systems over interfaces. In this case, you receive a set of documents containing detailed descriptions of all the pictures and each respective operating option.
Process automation as an intuitive web application
We have developed a compact process control system for companies with a focus on recipe-controlled processes. The visualization is consistently based on the look and user guidance of modern apps and offers intuitive operation.

Our services at a glance
- Real-time acquisition, display and control of system data and parameters
- Design and implementation of PLC visualisations and user interfaces by in-house programmers
- Instinctive system operation
- Protection of key inputs with double querying
- Recording and logging of faults
- Unification of data interfaces
- Data exchange with other systems
- User management
- Identification of vulnerabilities
- PLC programming
- Testing and simulation
- Documentation
- Simplified troubleshooting through clear and structured error messages
Our visualisation adds a user interface to your PLC, thus providing you with clear, complete and user-friendly monitoring of your system while helping to increase productivity. When commissioning the PLC programming, put some thought towards visualisation and benefit from a total package programmed by our experts. We are looking forward to receiving your enquiry!